
Some abnormal situations of SCAN

Hello everyone, there are some abnormal things. Could you please explain it.
1. For the station 'SCAN_Fort_Assiniboine' there are two strange things.
1.1 From 2018-03-16 to 2018-03-20 there are heavy rainfalls. However almost no changes of the soil moisture in 5 cm or 10 cm happen. Why could this happens?
1.2 Around 2018-03-23 there are some rainfall, which leads to the soil moisture increase. This make senses. But the increase of soil moisture in 10 cm is much higher and earlier than soil moisture in 5 cm. Why?
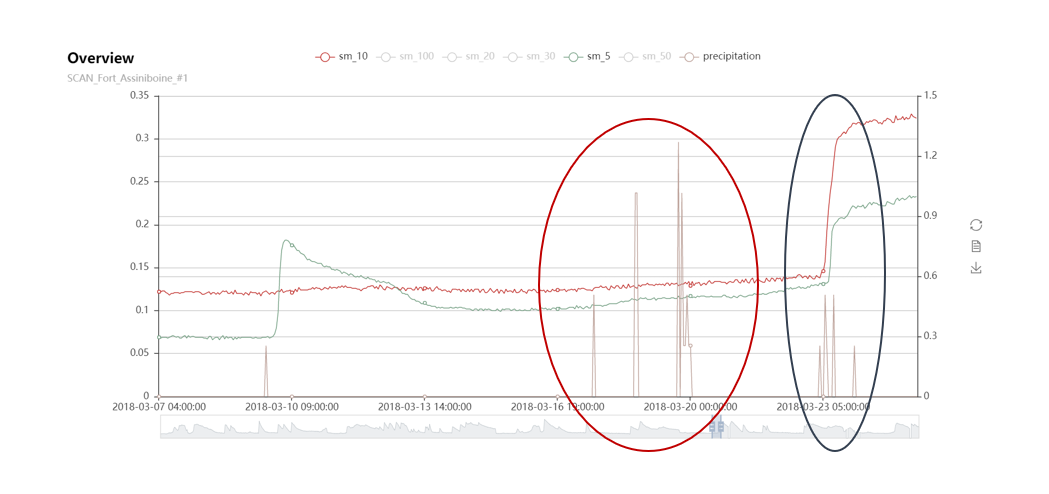
2. For the same situation, there are almost no precipitation but the soil moisture of 5 cm increase sharply. Is there any other factor to influence the soil moisture except the rainfall?
Thank you in advance. ![]()
Comments
Dear Yuting,
Thank you for your questions, we hope that we answered them to your satisfaction:
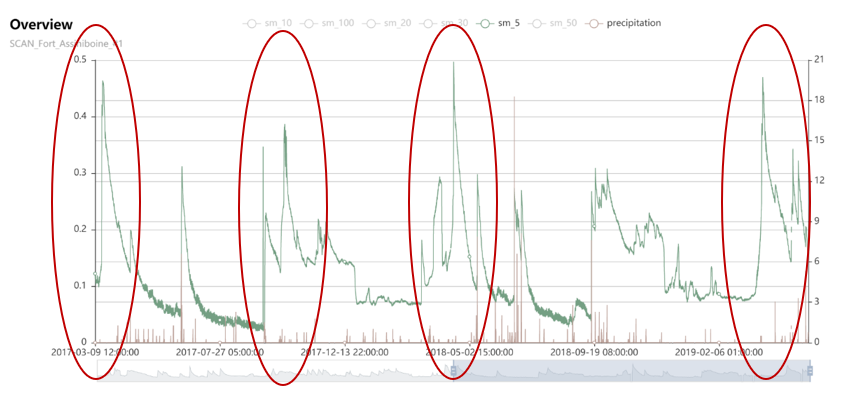
Here you can see in one plot that the rain is minimal and therefore the soil moisture increase seems to be occurring in a normal way. The reason why you have a "big" soil moisture rise in the beginning and end of this graph could be due to very dry soil conditions and its incapacity of infiltrating water in the first minutes of a rain event. It could also be a sensor failure which are tricky to catch. But as you might know we apply quality control to ISMN data where we also trace soil moisture rise without precipitation events (flags D04, D05). Information on the flags, should be included in your downloaded ISMN data. More information on ISMN quality control.
If you want to know more about the soil properties of this station we can recommend our python ismn data reader on github. This module allows you to plot additional metadata info (soil types, climate class, landcover), for the downloaded ISMN data, per station. Maybe this helps with your analysis.
Hopefully we answered all of your questions but if you have any further questions, we are happy to help!
All the best,
your ISMN-Team